
One of my favorite social media activities is collecting charts and visual data related to book publishing and other media, which come in handy for speaking at conferences and providing insight into how the industry is changing.
I use Pinterest to save them; view or follow the board here. Here are 5 of my favorite charts pointing to the evolution of the industry.
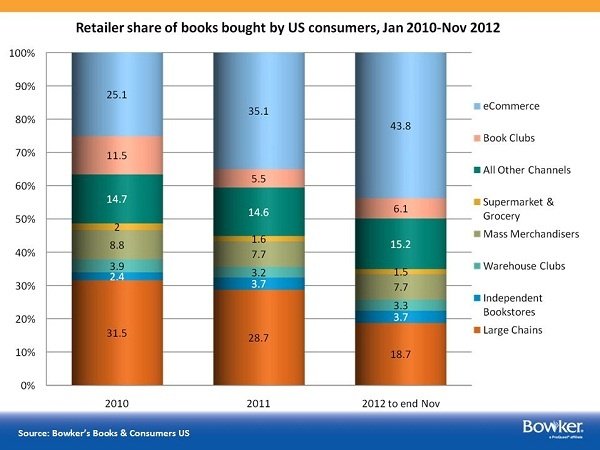
Source: Bowker’s Books & Consumers US; find out more about this report at Digital Book World. If anyone has seen 2013 figures, please let me know in the comments.
Key takeaway: By the end of 2012, nearly half of US book sales (print + ebook) were happening online (eCommerce), which is primarily driven by Amazon. Notice how the large chain bookstore retail share drops from 31.5% to 18.7%, driven in part by the bankruptcy of Borders. While many people focus on the percentage of ebook sales (currently averaging about 30%), I’d argue it’s more important to keep tabs on where the majority of sales are happening, regardless of format. This directly affects the value proposition of traditional publishers (at least for now) and how books get discovered and/or purchased—increasingly online through tech giants such as Amazon, Google, Apple, etc.
Source: Nielsen Bookscan, 2004–2013, reported on by Publishers Marketplace (subscription required).
Key takeaway: This chart shows print sales (in units) in the US print book market, which peaked in 2008-2009. In a 2014 presentation, Nielsen discussed how nonfiction adult sales peaked earlier, in 2007—but that children’s book sales are still ahead of their 2007 levels and comprise a larger part of the print market, meaning physical stores are important to that market (more so than adult books), and/or haven’t as successfully transitioned to digital.
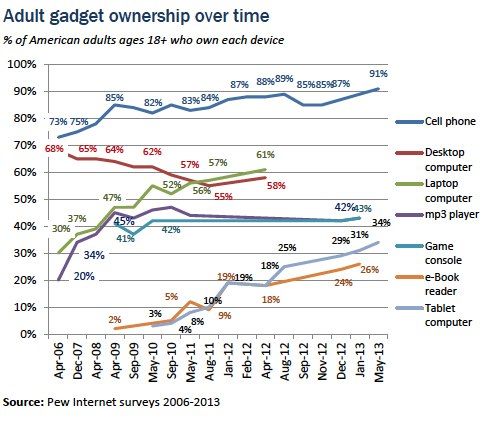
Source: Pew Internet Surveys, 2006–2013
Key takeaway: Mobile- and tablet-based reading environments already play—and will continue to play—an increasingly important role in how people discover, purchase, and consume content. Also notice that ebook readers are the least popular “gadget” on this chart; many people disagree on whether this will remain stable or decline. (Some say avid readers will always prefer a dedicated device; my personal opinion is that most reading behavior will shift to tablets or phones). Whether you have a website, e-mail newsletter, book, magazine—anything—to be successful for the longterm, you must consider the growing percentage of mobile- and tablet-based users. (Obviously, this is a much bigger trend affecting every business and organization.)
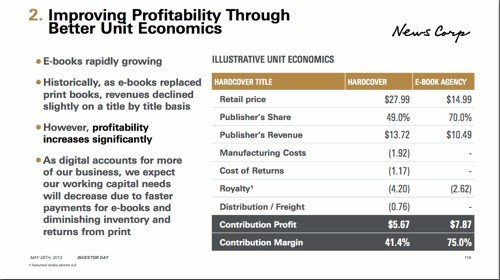
Source: HarperCollins presentation to News Corp.; reproduced at Publishers Marketplace
Key takeaway: E-books are significantly more profitable for publishers than print books, primarily because Big Five ebook royalties remain at 25%. Publishers Marketplace comments, “On a hardcover, the author earns 30% of the publisher’s gross revenue, and 42.5% of the total margin (what the author and publisher together earn). For now, on the ebook, the author earns 25%.” Read more (subscription required). The big question, of course, is how long can publishers keep the royalty rate at 25%? Hugh Howey has been asking this question, very publicly, over at AuthorEarnings.com.

Source: Nielsen white paper from January 2012
Key takeaway: There is an unsurprising link between good metadata and sales. This particular report shows how complete metadata gives a sales boost to all book categories, but especially fiction, probably because fiction titles benefit from additional contextualization to aid searches. (If you’re looking for a nonfiction book on rose gardening, you can probably find it based on title and category; if you enjoy novels that take place in Europe in the 19th century, you’ll have a harder time unless that context is included in the metadata.) At BEA 2013, I listened to a panel on metadata, and the most memorable quote was from Phil Madans of Hachette: “If you don’t want your books to be found ever, use the Fiction: General category as your BISAC code.” For authors, this means: Don’t ever publish and distribute a book categorized as “general fiction.”
Do you have interesting charts or graphs to share about what’s happening in the publishing industry? Share links in the comments.
If you enjoyed this post, you’ll love my Pinterest board devoted to media industry stats.

Jane Friedman has spent her entire career working in the publishing industry, with a focus on business reporting and author education. Established in 2015, her newsletter The Bottom Line provides nuanced market intelligence to thousands of authors and industry professionals; in 2023, she was named Publishing Commentator of the Year by Digital Book World.
Jane’s expertise regularly features in major media outlets such as The New York Times, The Atlantic, NPR, The Today Show, Wired, The Guardian, Fox News, and BBC. Her book, The Business of Being a Writer, Second Edition (The University of Chicago Press), is used as a classroom text by many writing and publishing degree programs. She reaches thousands through speaking engagements and workshops at diverse venues worldwide, including NYU’s Advanced Publishing Institute, Frankfurt Book Fair, and numerous MFA programs.


Great information, Jane. Thanks for sharing.
[…] Jane Friedman writes You’ll find this name popping up everywhere when you venture into writing web […]
This is EXCELLENT! Thank you for posting, particularly the key takeaways.
Fantastic! About a year and a half ago, I’d wondered about the eCommerce vs. brick-and-mortar sales percentages. Thanks for finally answering that question! 🙂
I’d love to see even more updated numbers on that aspect, so if you happen to see them, let us know!
I was interested to see that the “independent bookstores” category increased and held steady as a percentage over the three years in the first chart. The increase in e-commerce sales wasn’t on their backs, as many people fear, but rather on the giant bookstores’ sales among a very few categories. (I am curious what might have happened with book clubs two years ago that cut their share in half ….)
Book clubs have been declining for a looooong time (think Book of the Month Club, Quality Paperback Club, etc). The publishing company I used to work for shut down their numerous clubs at least 5-6 years ago. “Clubs” have morphed into something else: websites, blogs, e-mail newsletters, Goodreads communities, membership and loyalty programs, etc.
Good point. I hadn’t thought about how Goodreads communities in particular might step on those kinds of “selected by genre” clubs.
Good graphs, thanks!
The reason ebooks are so much more profitable for those intermediating (not writing the books) between authors and readers is because they take more than in the format where they actually have substantial manufacturing costs. Doesn’t that sound suspiciously like acting as a cartel to use an unfair royalty rate established when ebooks were an afterthought (if 25% was fair, that’s what they’d be paying in hardcover, too) and as an industry, stiffing authors on ebooks when the value of the publisher (printing presses, ink, paper, trucks, shelf-spacing returns policy) is limited to cover design, editing and pressing upload? Am I missing some nuance here? Note to self: start publishing company that pays 50% and handles all packaging and marketing. Still make fortune. Repeat.
There should be a Business 101 plaque posted at the start of all these discussions: Publishers, like all businesses, have overhead and costs that go far beyond what you continue to state as simply “manufacturing costs.” Please educate yourself. Publishers, whether as mega companies or running a small ebook press that has a 50-title list, do *not* make large profits, period. And by the way, falling in love with those mega corporations that control every penny you make (if you make any) sell ebooks as a so-called “independent” author is a very very unwise thing to do.
Deborah, perhaps you can explain to me, in simple language an obvious neophyte like me can understand, why the publishers, whose models did just fine with their fixed costs when it was just hard copy, suddenly require 25% more gross profit on ebooks to cover those identical fixed costs (actually fewer if you think it through)?
And while doing so, perhaps you can also help me apprehend what book vendors, which are a channel (you know, B&N, Amazon, Kobo, Google +, Apple…), have to do with manufacturers/publishers? Beyond that one manufactures ebooks and sells them through the store, and the other is the store, which among other things, sells ebooks, including those manufactured by trad pub – and my own.
Here’s a newsflash of the new reality. I hire editors and proofreaders, so I have production costs in each book, just like a trad pub. I hire cover artists, so I have those as well. I pay for advertising. So ditto on it all. How is my publishing company, which does these things efficiently enough for me to sell hundreds of thousands of books per year, any different when selling through the above mentioned electronic storefronts than a trad publisher, other than “fixed costs,” which in this case to me looks like layers of undesirable inefficiency? Bluntly, what will that publisher do for me in the ebook market I am not already doing in exchange for that mammoth difference between 100% of net and 25% of net?
Citing fixed costs, WHICH WERE THERE EVEN WHEN THE MARKET WAS ENTIRELY PAPER, as the reason it’s reasonable for trad pubs to take considerably more of the net than from a paper book, is at best ill-informed and at worst specious, as is going off on an anti-Amazon rant thinly disguised as an anti-big-corp rant (the big publishing corps are somehow good, but the big store corps are, well, bad – because they don’t take nearly as much of my money…) when we’re discussing publishers, not vendors.
Respectfully,
Russell
As a hybrid author who sold through Big 6 for years and now runs a small press that sells mostly ebooks while still maintaining print sales, my point is: the statement that “traditional publishers have nothing to offer except the manufacturing of print books” was the discussion here. Not an accurate statement even for authors who are solely competing in ebooks and who, like yourself, are very capable of handling the publishing side of their own ebook business. If trad publishing had nothing to offer ebook indies, then the Hugh Howeys of the world would not be in partnership with it.
I’m not pro-trad or anti-Amazon. I’ve made a lot of sales in both places, and I see the value of both venues. What I note is that the commentary on the indie discussion forums veers sharply pro-Amazon to say the least, while hurling a constant and consistent barrage of vague accusations, half-truths and often ignorant assessments of traditional publishing in general and big publishing in particular.
But Amazon is not the Shining Knight to your rescue.
Amazon is a platform, not a vendor. Authors provide product, content, entertainment for its general customer base. Amazon controls a world of its own, a massive one that is growing bigger with every second. A world that uses books as loss leaders and bait (read any informed background on Jeff Bezos for this well-known info) to lure customers to higher ticket items. The goal is not to empower authors in the big long-term picture, but to use their output as efficiently as possible to help the bottom line. Luring millions of self-pubs to Amazon was brilliant–they’re shoppers!
The cuts in ACX royalties are no surprise. Cuts to KDP author profits probably won’t be as blunt but will happen before much longer. Ebook prices will continue to be driven downward by internal maneuvers and other pressures, all in an effort to woo Amazon customers into signing up for higher Prime costs and other new bonus programs.
The hybrid authors I know, most of them veterans of 40-50 novels, now self-pubbing successfully in ebooks, are seeing the canaries starting to keel over in the coal mines. Profits falling. Book prices not just trending downward but plummeting. Rights sliding away as technologies and start-ups invent new ways to use books as a data-gathering tool, like a come-on outside a strip club–ways to sell books cheaper, not sell books better. Talk among the authors who’ve been around since forever, the ones with a lot of experience in trad and indie publishing, is turning to ways of finding the core readership and selling directly to them. Of focusing on fewer readers, not more.
Pie in the sky stuff, but at least the discussion has been seeded.
All I’m saying is this: Trad pubs are not an author’s best friend. But neither are the (Insert whatever term you want to call the places where you upload your ebooks while agreeing to the lending/subscribing/matchbooking/nibbling of profits system that controls how your books are sold.)
Don’t make the mistake of assuming authors have any safe havens unless we build them ourselves.
None of which answers my direct question: Why is it reasonable for trad pubs to get significantly more of the net on ebooks as opposed to paper? Simple question. Very long non-answer.
A follow-on: I never said “trad pubs have nothing to offer, blah, blah”. See my above actual question to you.
To clarify, Trad pubs have value for authors who can’t or won’t manage their own publishing business, and are willing to give away 75% of the net for someone else to do it. They also have value for authors who favor the advance over the actual book profits. And they have massive value in paper distribution – in my genre, airport sales are significant, and you can’t get those unless you’re with a trad. They also have an infrastructure, which can be replicated, but is a pain to do and carries with it a cost – editing, proofing, cover design, formatting. And they have scale, which is another way of saying that they can use profits from some books to market either those books, or more commonly, their big names. Which is one of the reasons I think their model is antiquated and needs tuning. But I digress.
Amazon is a channel. So is B&N. So is Apple. So is Kobo. They sell books. I sell books. I use them all to sell my books. So do all the trad publishers. If they feel that Amazon is the enemy, perhaps instead of colluding to price fix, they should pull their titles from Amazon and test where the power in the new landscape lies?
If, at some point, Amazon decides to lower royalties, they will hand Apple, Google, B&N, Kobo a massive advantage to be exploited. My hunch is Amazon doesn’t want to hand its competitors lunch. I could be wrong.
Corps are for-profit entities. They exist to create shareholder profits, not for altruistic reasons. Every dime not paid to an author is another dime in the corporate kitty for a publisher – it’s zero sum in that respect. Thus, their imperative is to pay authors as little as humanly possible. That’s neither surprising nor alarming. It’s expected to anyone with a background in business, which by now you might have surmised I have. Amazon is also one of those money-grubbing corps, and its job is to do what’s best for Amazon. If it wasn’t doing so, management should be fired.
As CEO of my publishing career, my job is to make smart business decisions that maximize my profit. Right now, Amazon pays me 4X what a trad publisher would on ebooks. That’s awesome for MeCorp. If they lower what they pay, as CEO of MeCorp I will need to determine how to adapt to the new environment. Until then, things that could happen, like me dying tomorrow, or a solar flare wiping out all electronic transmissions for years, or people ceasing to read or being unwilling to pay me handsomely for my prose, must take a back burner to the mundane business of commerce. And right now, barring a mid-six to seven figure advance from a trad on a one book deal, Amazon and its competitors are the best game in town. Are. Not might be. Or might not be at some point.
I’m sorry if competitive market forces are reducing the price readers expect to pay for books, thereby adjusting to supply and demand. I view that as net very positive, as it means more content at more affordable prices, which would theoretically make reading more accessible or appetizing. The truth is that books are free these days – you can download more free content over a long weekend than you could read in ten lifetimes. Creating the perception of value for my content hasn’t been a problem for me – my work sells for $5-$6, and does so briskly. Net, that pays me far more than a trad pub would pay me for a similarly priced ebook, or even for one priced double – which assumes that consumers would pay double in a competitive market (which they are increasingly uninterested in doing for any but the largest names, which I think was one of your points, not mine).
Having said all that, I would embrace a trad deal just as I currently embrace the ebook channels. It’s just business. Business 101, actually, to use your term. Our difference in view is that I don’t bemoan the good old days or view change as negative or positive, only as a constant of business. You either adapt or you perish. It’s always been that way. If Amazon lowers royalties, they risk competitive pressures burying them. Given that they already make 30-40% (blended) from content that they have zero production cost on, I’d argue that your prognostications of them doing what ACX did (yes, an Amazon company, but one without any real competition) might be a tad skewed and alarmist. At some point we’ll both know whether my take, or yours, is correct. In the meantime I will continue selling lots of books, earning a more than generous living doing what I love, and avoiding taking hyperbolic positions that relate everything in an adversarial light.
Business is always about the other guy trying to eat your lunch. Always will be.
To expect anything else…
Proofreaders hired by publishing companies? Really? I’m skeptical, since I constantly stumble across typos that could only be missed by Microsoft Word’s spell check.
Well, what publishers have to offer to new authors today has little to no interest. Their standard contracts are impossible to sign. Talking from personal experience.
Times changed. The moment when a publisher offers you a contract and makes you jump to the roof with joy is over. You read it, you look at the clauses and you go “These guys are crazy” and use the contract to fill the garbage bin.
Interesting information. Thanks, Jane. Must click on your Pinterest link.
Fascinating, thanks for sharing these visuals. I was suprised to see how tiny the share of independent bookstores is… and I wonder why book clubs have lost so much ground– or rather, why some savvy entrepreneur(s) have not revived them. As a long-time blogger and blog reader I do not see how book blogs have quite filled that old niche. My own sense of things is that too many corporate players (large publishers and chain stores) have tried to treat books as a commodity. They are, of course, but they aren’t, of course.
As far as I understand the chart, “book clubs” refers to the old-style clubs where you received a monthly mailer and would receive the book of the month unless you took action NOT to receive it. That’s not a model that’s very practical (or profitable) in the digital age. As someone who used to oversee one of these book clubs and manage the financials, the profit margin was very, very slim, and was based on sending people books who couldn’t be bothered to return them.
Digital-age book clubs (if you can call them that), look more like this (I hesitate to call them blogs—more like communities):
http://250words.com/
http://boingboing.net/2014/03/12/wink-daily-reviews-of-remarka.html
http://www.washingtonpost.com/blogs/style-blog/wp/2014/03/10/new-rooster-app-crows-about-good-books-young-and-old/
Thanks, Jane, this is very interesting to know… if depressing, the idea of selling books to people who cannot be bothered to return them (!) P.S. Sometimes I think a good business would be a personal off-site personal book storage service, as for wine storage.
I think that would be a great business, and I’d like to sign up my partner as the first customer! 🙂
Thanks, Jane, excellent information. The big question for me is where we will be in five years. Will ebooks reach 50% of the market? Will indie published books reach 40%? If that happens a tipping point will be reached, IMO, and what we know today as a publishing industry will be radically different.
The challenge ahead for writers is real too. We must create books that compete well with apps and TV series.
I’d be willing to bet 50% ebooks in five years; for genre fiction bestsellers, many Big five are already seeing 50% ebook sales. The average is brought down to 30% by other categories that don’t sell well so far in digital formats, such as illustrated works and children’s books.
I think it would be wise for the larger writing/publishing community to focus less on competition among each other (e.g., indie v.s traditional), and look for ways to be competitive (and/or collaborative) with all other media, as you well point out. I’m 1 year behind on my New Yorkers and the reason is simple: TV and apps.
The big question for me is whether we’re already there. Just looking at that first chart, from Bowker–I’m trying to figure out what they’re measuring by. I know Bowker issues ISBNs, so that’s my first guess, but even after following links and clicking around the Nielsen Market Research site I can’t figure it out.
If it is by ISBN, it’s incomplete (and if it’s self-reported it’s likely even more so). While corporate publishers generally use them, none of the digital retailers require them for distribution when authors go through them directly. Most of the indie ebooks sold on Kindle don’t have ISBNs, and while I think Smashwords does implement them in their premium distribution, you can still publish to the iBookstore, Nook, and Kobo stores without them (again, if you go directly). Just looking at the top 20 Kindle bestsellers right now, it looks like 25% of them don’t have ISBNs (the Fixed trilogy, Hidden, Tied With Me, and Destroyed). In that first chart, that e-commerce portion is likely substantially more than 44%; there’s just no telling how limited a view of the book marketplace most publishing industry analysis is actually seeing.
It’s also interesting to see NewsCorp talk about increased profitability despite decreased revenues. I like how they mention decreased returns and cost of manufacture; as was pointed out above, my guess is it also has to do with how much of the revenue are getting to the authors themselves.
Great point about competition/collaboration with all other media, though. Especially when apps are so popular and widespread, and indie developers are achieving more with games than ever before. I just played a great game, Gone Home, that was one of the purest and most visceral storytelling experiences I’ve ever had. Highly recommended. But I’m also reading Stephen King’s It, and I’ll highly recommend that, too.
Yes, that first graph is representative of sales in the traditional book publishing market. I wouldn’t be surprised if, looking only at the indie market, if it was seeing 95%+ online retail sales (of either print/digital formats), and 75%+ ebook format.